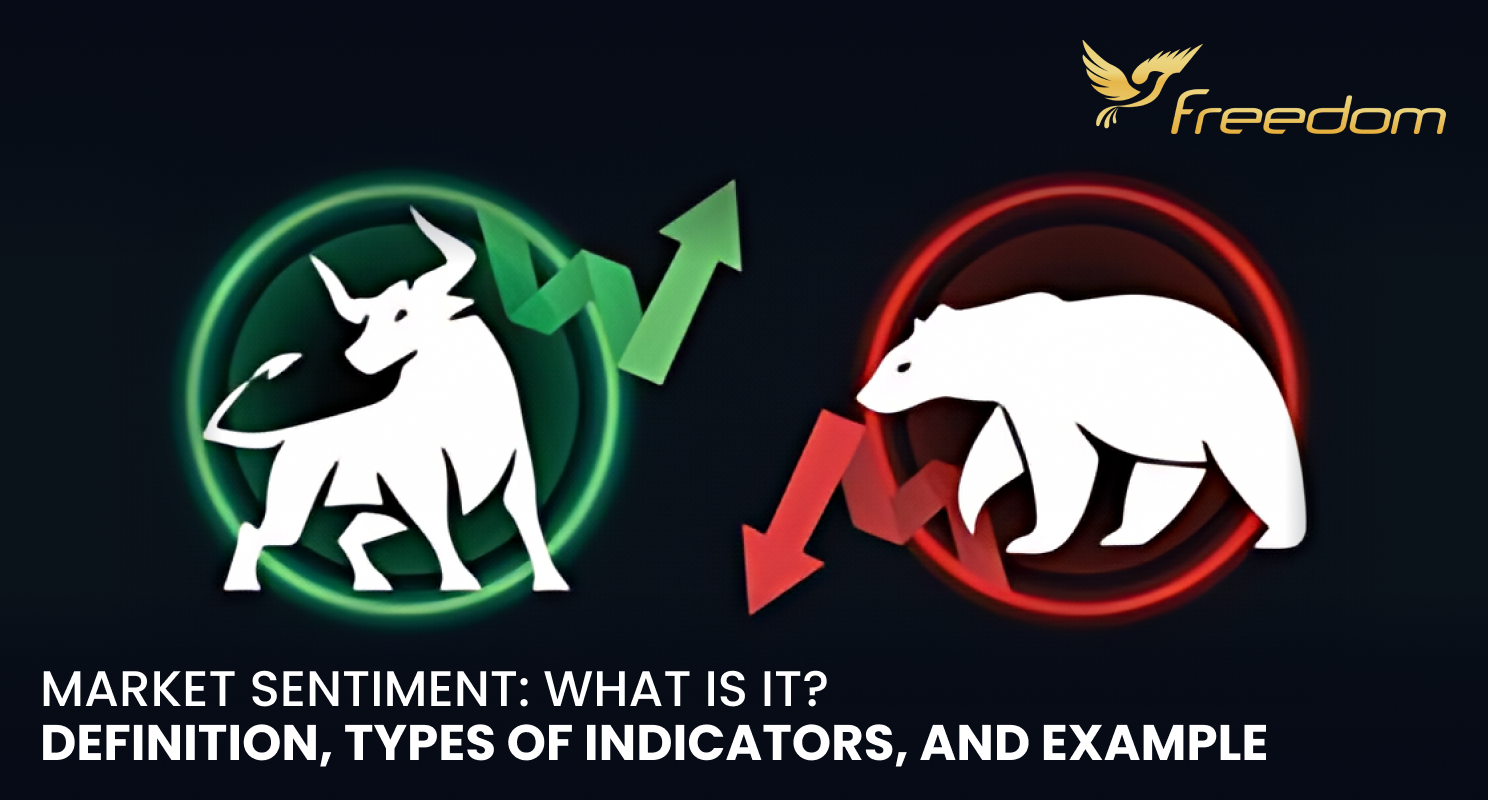
The general perception that investors currently have of a business, an industry, or the financial market at large is known as market sentiment. Crowd psychology affects the tone of the market. Buying and selling activity makes it clear. In general, rising prices imply optimism about the market, while declining prices suggest the opposite.
Market Sentiment: A Brief Introduction
There is no discernible relationship between market sentiment, often known as investor sentiment, and underlying shifts in the market. Since market sentiment affects the indicators used to measure and profit from short-term price swings brought on by the crowd psychology of active participants, day traders and technical analysts rely on measures of market sentiment.
For contrarian investors who trade against the existing consensus, market sentiment is also crucial. A contrarian would, for instance, sell a stock if everyone else was purchasing it to benefit from the upward advance.
It’s common to characterize market sentiment as either bullish or negative. Prices decrease under a negative sentiment. Bull markets see rising stock prices.
The stock market is frequently driven by emotion, so market sentiment has nothing to do with a stock’s intrinsic value. Prices fluctuate for a variety of causes other than those that a fundamental examination would suggest.
Market sentiment pertains to general worries, hopes, and feelings on the market, whereas fundamental value is centered around actual business performance.
Sentiment Indicators for the Market
Purchasing equities that are mispriced because of market sentiment helps many investors make money. They employ several indicators, such as the CBOE Volatility Index (VIX), the high-low index, the bullish percent index (BPI), and moving averages, to gauge market mood to help them choose which stocks to trade.
The VIX
Option prices are what fuel the VIX, sometimes referred to as the fear index. The VIX, a vital tool for traders, shows the anticipated volatility of the S&P 500 index.
Elevated VIX levels may indicate more concerns and maybe a bottom in the market. A low VIX is interpreted as a sign that a market may have peaked and can indicate market complacency.
Bullish Percent Index
The number of equities that have hit 52-week highs and the number of stocks that are at 52-week lows are compared by the high-low index.
When the index falls below 30, investors’ opinion toward the market is pessimistic and stock prices are trading close to their lows. Investors are bullish when the index is above 70 and stock prices are trading close to their highs. Traders usually use the indicator on a particular index, like the Nasdaq 100 or the S&P 500.
Moving Averages
The 50-day and 200-day moving averages (MAs) are commonly used by investors to gauge the sentiment of the market.
The “golden cross” occurs when the 50-day moving average crosses the 200-day moving average from below. This suggests that the market’s momentum has turned positive, fostering a bullish attitude. The “death cross” occurs when the 200-day MA is crossed below the 50-day MA. It implies a drop in pricing and a pessimistic outlook.
Utilizing Market Sentiment: Its Limitations
Market sentiment is a useful instrument in financial markets, but it has limits. Fear and greed have the most power to influence the herd mentality. It’s not always a response to a stock’s or market’s fundamentals.
Furthermore, especially in quick-moving, highly liquid markets, short-term news, events, concerns, and even rumors have the power to influence market mood. When investors are feeling pessimistic, it may indicate that a peak is about to occur. Conversely, when they are riding high on optimism, the opposite may be true. Therefore, excessive market volatility may result from irrational market sentiment.
Remember that in short-term trading, market mood is more akin to a sprinter than a marathon runner. It is more beneficial to diversify your portfolio and consider the broad picture if you are in it for the long run.
Examples of Market Sentiment in the Real World
The stock market frequently experiences extreme fluctuations between positive and pessimistic feelings due to an uncertain economic outlook. An illustration from the early 2020s will do. The figure below illustrates how panic among equities investors increased at several times in 2022, causing the S&P 500 to experience intraday volatility not seen since the Great Recession of 2008.
The response of central banks and high inflation were probably to blame. In the conventional economic cycle, a recession will eventually be brought on by increasing borrowing costs once interest rates start to rise noticeably.
A lot of investors began selling as they became concerned that the economy was going to collapse. Still, a few others tried to profit from their nervousness, believing that a recession would be avoided. The economic despair and gloom gradually faded.
Market Sentiment in 2023
Despite initial concerns, economists became more optimistic in 2023 that the year would not finish in a recession. Investors rapidly became positive because they were eager to profit from equities markets that were priced to represent an economic collapse. The VIX started to decline steadily while the S&P 500 started to rise once more. The VIX indicator of volatility was at a three-year low by September 2023. That implies that tension decreased.
There will eventually be another shift in economic sentiment. As the economy changes over time, analysts and investors modify their projections. Bullish feeling can emerge at the sight of any favorable economic data when the market begins pricing in extreme outcomes, such as an economic disaster.
The mood of the market is incredibly volatile and sensitive by nature. The market becomes susceptible following a time of optimism, when valuation multiples indicate a favorable future. Investor sentiment can change with even small bad news, making bullish investors bearish once more. Looking to start your trading career? Join Freedom!


